
1. Summary
While some authors claim that “Python is the new Excel”, we believe that Excel is the right tool for handling not large amounts of structured information and performing basic interactive data analysis. Excel workbooks serve the role of small databases and are the preferred format for exchanging structured information, along with easy-to-build good-looking dashboards built upon it. In most firms, Excel is the first tool for effective monitoring of projects and operations. Excel’s integration with other MS Office tools then makes it an essential tool for sharing analytical insights.
For larger data sets or for advanced analytics, Python is the right tool.
2. What is a Spreadsheet
Originally, the spreadsheets were designed to digitize bookkeeping (the first spreadsheet software VisiCalc was launched in 1979). With the increase of computers’ processing power, a spreadsheet became a tool used for organizing, storing and analyzing data, most often calculating summary statistics.
A spreadsheet is essentially an infinite grid of cells where each cell can be either a value (text, number, picture), or a formula referencing other cells. The calculation tree stemming from the cell’s formula dependencies (e.g. A1 → B3 → C2) makes a spreadsheet incredibly powerful and all the recalculations are efficient – a change in a cell value causes recalculations only of dependent cells of the updated original cell. Spreadsheet software then adds to each cell additional features, like formatting, annotations and allows generating of charts, summaries, and filters.
The dependency tree calculations makes spreadsheet an excellent tool for what-if analysis – you can change one number and immediately see how the results change.
Spreadsheets are excellent for quick collection of data and are the best way to organize tabular information.
When using a spreadsheet, you’re incredibly productive – it’s a visual calculator, promoting creativity and visual thinking – the worksheet is like an infinite canvas and all design is visual rather than declarative
As a visual tool, a spreadsheet reduces cognitive overload with cognitive overload being defined as “how many logical connections or jumps your brain has to make in order to understand or contextualize the thing you’re looking at.”
Some of the most powerful tools a spreadsheet offers are basic functions (such as IF, TRIM, UPPER, PROPER), filtering and sorting, and pivot tables:
A pivot table lets you create a one-page summary report from hundreds of thousands of rows of data, often in four, five, or six clicks. It is the fastest way to get answers from large datasets.
-Bill Jelen
2.1 Spreadsheet Horror Stories
While spreadsheets are very easy to create, they are also very easy to misuse – see the list of the horror stories at the European Spreadsheet Risks Interest Group.
Examples:
- Billion-dollar trading losses
- Misguided notions about fiscal austerity
- Why Geneticists Hate Microsoft Excel – Genes and Data Entry (popularmechanics.com)
Close to 90% of spreadsheet documents contain errors, a 2008 analysis of multiple studies suggests. “Spreadsheets, even after careful development, contain errors in 1% or more of all formula cells,” writes Ray Panko, a professor of IT management at the University of Hawaii and an authority on bad spreadsheet practices. “In large spreadsheets with thousands of formulas, there will be dozens of undetected errors.”
Source: 88% of spreadsheets have errors
2.2 Extreme Uses of Spreadsheets
- Steve Ballmer, a former Microsoft CEO, famously used Excel plan his time in 10 minute intervals
- Excel Unusual
- Spreadsheets for Fun
- Excel Art
2.3 Future of Spreadsheets
- In November 2020, AWS introduced Honeycode, their spreadsheet based no-code app development service
3. What is Excel
The world is run on Excel. Excel has more than 750 million users. It’s used for structured data entry, to organize, classify, manage that data, and to perform simple analysis of that data. It’s used for simple and quick solutions to complex problems where alternative solutions would take substantially more time.
Excel is built upon the concept of a workbook, which is a collection of a number of worksheets. A workbook also can contain VBA / Office Script code.
Excel is part of MS Office which is installed on virtually all business computers. Excel is perfectly integrated with other MS Office applications, so you can create a beautiful chart in Excel and copy and paste it into a PowerPoint presentation. All Excel workbooks are immediately printable and shareable in best quality.
Export to Excel is a standard feature of any tabular data export.
Excel workbook is a collection of worksheets and can serve the role of a very simple structured database. The type of joins between different sheets is limited, but sufficient for basic operations – see the Excel’s functions VLOOKUP, HLOOKUP, MATCH, INDEX, CHOOSE, INDIRECT.
Excel provides best in class interactive data exploration tools and in the shortest time you get excellent looking visual interpretation of data.
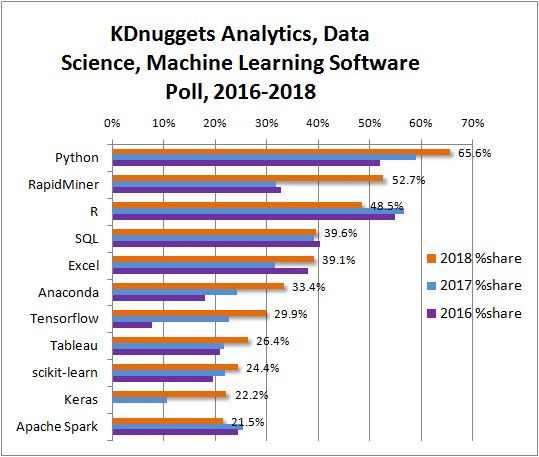
Excel is one of the most widely used tools by data scientists:
3.1 Limitations of Excel
- Excel is not a proper database supporting complex data types, backups or relationships and is very difficult to scale up.
- Excel does not support natively any version control – neither on data, nor on the VBA code.
- Sharing a workbook without it being stored in OneDrive and editing it in Office/Windows 365 is difficult since every user keeps his/her own version.
- Excel’s scripting language VBA is very slow and cumbersome to use on large scale → you should prefer C# add-ins.
- Any programmatic access to Excel COM objects has to be done on the UI thread which makes any code rather slow. There are workarounds, however, which mitigate this problem.
- The 32-bit Excel has significant memory limits, whereas the 64-bit Excel is the recommended installation nowadays.
3.2 Recommended Uses of Excel
- Simple Structured Databases and Any Types of Plans / Schedules – Efficient project-management usually requires processing of structured data – an Excel worksheet is just a table storing structured data – so project plans, time schedules, testing schedules, lab schedules, budgets, lists all are most suitable.
Furthermore, if you store the workbook on the cloud (Dropbox / OneDrive), you can edit the workbook on your cell phone / tablet with the Office for iPhone / Android.
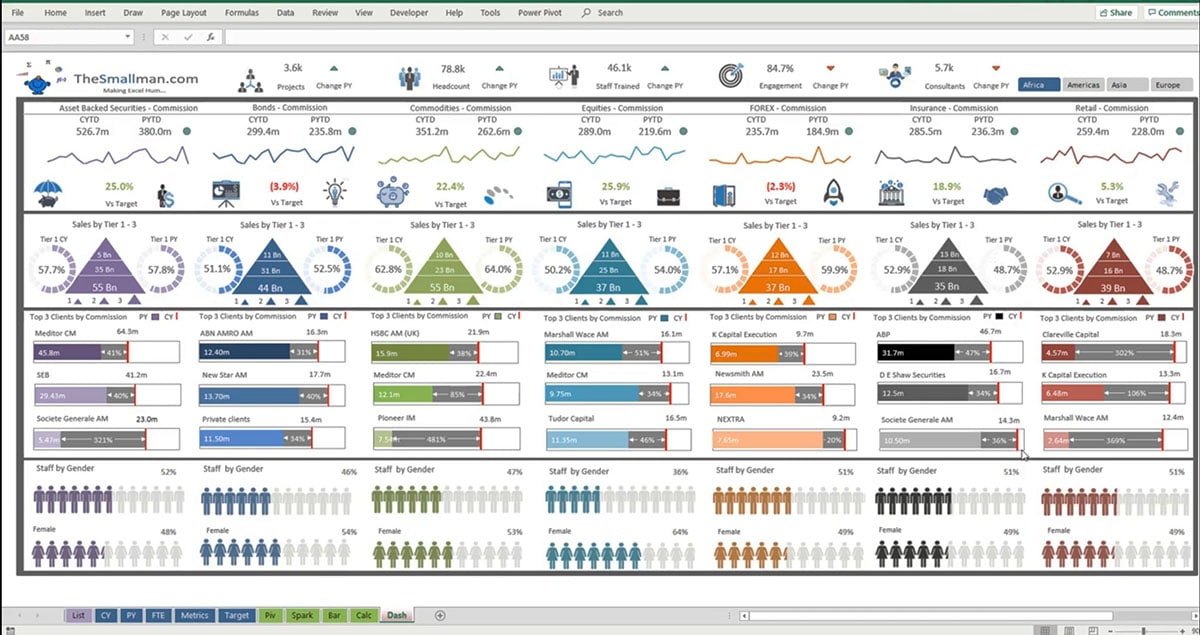
However, as soon as the amount of data becomes substantial, you should move to specialized tools. For example, for personal financial accounts, I recommend Quicken; for books / movies, Book Collector / Movie Collector. If there is no specialized tool around, use for the database MS Access from MS Office until you can migrate to the server-based database. - Real-Time Dashboards – Either by using Excel’s native data sources, or via UDFs (User-Defined Functions), one can build the most computationally-efficient and complex dashboards updated in real-time with flashing changes. In addition, Excel charts are beautiful and easy to create and to modify. Here is where custom C#-based UDFs come into picture. See this video on professional dashboards.
- Tables / Charts for other Office apps – All Office apps are perfectly integrated.
- Interactive Calculators with What-If functionality – Excel’s spreadsheet / tabular format allows for easy calculation of complex formulas, with an easy probing of the results by a What-If functionality – just change a cell’s value and only it’s dependencies get recalculated.
- Easy Get-Feel Tool for Huge datasets (Exploratory Analytics) and CSV Viewer/Editor – Excel’s spreadsheets UI controls are one of the most intuitive interactive table controls available – just point and click your mouse – and I am not aware of any better tool than Excel to rapidly create pivot tables / pivot charts, filter tables and view / edit CSV files.
- UI prototypes for Data Centric Applications – One can create a very simple application processing data in Excel within minutes while in any other programming language it requires hours or days.
3.3 Not Recommended Uses of Excel
- Processing large amount of data – While Excel can process efficiently huge tables, it’s not recommended due to the high risk of data error
- Encoding sophisticated formulas – The more complex formula, the higher chance of it having a bug → use custom built C# UDFs instead
3.4 Future of Excel
- Office Scripts – In addition to the VBA, Excel supports Office Scripts which are written in either JavaScript or TypeScript.
- Custom Data Types – Microsoft announced in November 2020 support for additional data types, including hundreds of data types from Wolfram Alpha, including food, chemistry, space) and Custom Data Types. See video or video or an article with the details.
3.5 Best Practices for Excel Production Use
- Do NOT use Excel as the large-scale database. Store the data in some server database, and pull them from there.
- Do NOT create sophisticated formulas. Use custom built C# UDFs.
- Plan and test the spreadsheets
- Check Twenty principles for good spreadsheet practice
There are also Excel audit consultancies:
The process of examining each spreadsheet is unique. There are software and tools to look for inconsistent formulas or problems with the structure, but a human touch is still required, says Simon Thorne, a lecturer in computing at Cardiff Metropolitan University and a EUSpRig member, because logical problems can’t be picked up by such tools.
Part of the challenge of this work is that spreadsheet defenders must not only be Excel experts but know the industry that they’re working in. Beyond programming errors and typos, there are also logical faults — perhaps the cost of a product is counted instead of its revenue, says Thorne. “The logic is flawed in some way, and they [errors] are hard to spot because you have to be a domain expert to understand that it’s the wrong choice in a scenario.”
To audit a complex spreadsheet, Miric uses software to go line-by-line to spot errors, as well as ones that could crop up from continued use. One basic test is to change the inputs and see if the outputs react as expected, perhaps putting in extremely high figures or random letters. In short, that means this work comes down to spending entire days reading spreadsheets. “I would try and look at it and see if I could understand how it works without the person telling me,” says Lyford-Smith. “Usually, the answer would be no.”
4. Python
Excel is the right tool for managing data only up to a certain complexity of processing.
In the early days of computing, there were S+, Stata, R and other similar, sometimes very expensive, solutions. In the last few years, Python became the standard for processing of large amounts of data.
Compared to over 750 million Excel users, there are only about 10 million Python users.
4.1 Recommended Uses for Python
- Large-scale or more advanced data analytics – While processing more than 10,000 rows or 100 columns is easy in Excel, Python processes this volume of data much faster with extra comfort. Also, all statistics more difficult than linear-regression is done far more efficiently in Python.
- Data Analytics Reports – Jupyter Notebooks are the Python’s presentation tool.
- Batch Processing – Python is excellent for automation via batches with the ability to run identical scripts across operating systems.
- Web-site Development – Python is extensively used for creating attractive websites.
4.2 Jupyter Notebooks
The closest alternative to Excel Workbook is Python’s Jupyter Notebook – both provide database and presentation capabilities though their architecture is different. Calculations in Excel are done on calculation dependency trees (very efficient) while in Jupyter Notebook, all calculations are linear / sequential.
In general, Jupyter notebooks are useful for exploration and quick prototyping. They are not designed for production use. Once a Jupyter notebook reaches certain size and is re-usable, the best practice is to move the code into python files.
Jupyter notebooks are essentially a JSON objects so version control is again difficult.
Unlike MS Office which is installed on most business computers, Jupyter notebooks require a server to be set up and sharing is thus slightly more difficult.
Some authors claim that Jupyter Notebooks are the future of the data science.
4.3 Key Data Science Libraries
| Use Cases | Key Libraries |
|---|---|
| Artificial Intelligence | keras, pytorch, tensorflow, nltk, sklearn, scikit, imbalanced-learn, interpretml, lightGBM, openai, prophet, pycaret, pyspark, pytext, spacy |
| Dashboards | dash |
| Data Analysis | pandas, geopandas, numpy, scipy, dask |
| Data Analysis with GPU | cuDF, CuPy, cuml, fastai, fastml |
| Distributed Computing | fiber |
| Optimization | pulp |
| Statistics | statsmodels |
| Visualization | bokeh, matplotlib, plotly, altair, dash |